Expanding the Certified Management Accountant Toolbox
Using The Variance Tree to make superior price/volume trade-off decisions
May 2009
The Variance Tree aims to break business performance into its fundamental driving elements. It is similar to budget variance analysis — performing comparisons (calculating variances) and splitting the performance metrics into sub-elements. However, the difference lies in two key areas.
Managing the price /volume trade-off is at the heart of a business unit’s purpose. Fundamentally, there are two steps to assist with this process: gather and analyze the appropriate data and forecast the predicted outcomes under different sets of assumptions. However, we regularly find that businesses make pricing decisions based on gut feel because they have not completed either of these two steps with strict measures. Eventually, the question lands on the desk of a senior manager who feels ill-equipped to make a sound decision. These senior managers worry about the impact of their decisions because they know they risk misdirecting internal resources, leaving money on the table, or pricing their offerings out of the market.
CMAs strive to lead organizations to implement best-in-class practices for decision making and results management. Implementing measures to manage the price/volume trade-off has been a daunting task because finding accurate measures of price elasticity is elusive. However, by using The Variance Tree to help define and analyze the appropriate data, CMAs can bring clarity to the price/volume trade-off even if they are not yet able to forecast the alternative outcomes with accuracy.
The Variance Tree
The Variance Tree aims to break business performance into its fundamental driving elements. It is similar to budget variance analysis – performing comparisons (calculating variances) and splitting the performance metrics into sub-elements. However, the difference lies in two keyareas. First, we are comparing actual to actual rather than actual to budget, and second, we are focused on understanding what is driving the changes to the revenue line.
We compare current actual performance to a prior period because we want to see what has been happening to our business at the customer interface. The Variance Tree helps us understand how well a business performed, as opposed to highlighting whether it had highquality plans and targets. Usually comparing this year’s results to the same period last year will provide the best insight, as it naturally removes any effects of seasonality.
Building a Variance Tree requires one to assess what is truly driving the business. The Variance Tree focuses on the revenue line (or customer margin line) of the P&L (profit and loss) and using price/volume/mix variance calculations, it decomposes changes in business performance to illuminate the business issues. For example, has the quantity variance (in dollars) decreased because the business has fewer customers, or because its existing customers are buying fewer units?
Using a simple example of a chain of gasoline retailers, typical factors that drive a business are illustrated in a tree (Figure 1).
The first split is between price and volume. The impact of price changes can be further split into changes caused by increases or decreases in the price of wholesale gasoline, the retail margin and the premium the business charged for mid and super grades of gasoline. Similarly, as we use The Variance Tree to understand the impact of volume changes, we can see a change in the mix of grades, and the total number of liters sold. Working further down the tree, the impact of quantity can be split into quantity per customer and number of customers.
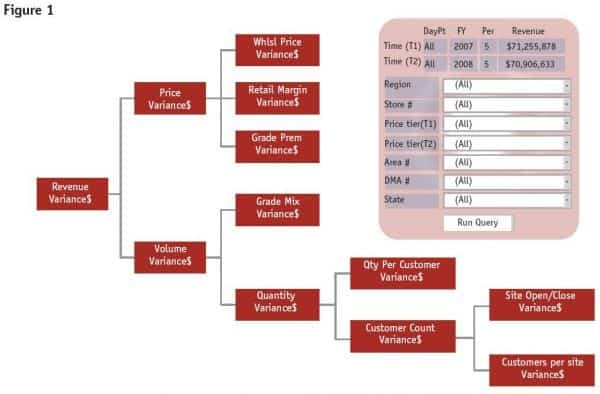
Understanding the results in a quantitative way helps managers raise key questions about recent performance. The Variance Tree highlights how a promotion has (or has not) brought in new customers, impacted the mix, and affected average price per customer. The Variance Tree should be built from the transaction level up, and therefore, provides the ability to drill into item level performance to help diagnose performance issues.
CMAs strive to lead organizations to implement best-in-class practices for decision making and results management.
Case Study: Decision making with The Variance Tree
The Variance Tree has been developed as a key first step towards helping managers manage the price/volume trade-off by decomposing the impact of recent decisions. This historical view can help challenge the mental models being used to make decisions. In the future, the same data can be extended to translate historical performance into a forecast of future results.
In these challenging economic times, businesses are using price reductions and promotions to maintain volume. While The Variance Tree won’t show what would have happened if a business did not reduce its prices or offered a promotion, it will clearly show the impact. For example, at one restaurant chain in the family dining segment, managers chose to promote entrees at $5.99. This price point was considerably below historical average meal prices. The result was a significant negative price variance (on the meals where the price was reduced) and negative mix variance from customers who traded down from higher priced meals. However,because the promotion was done as a stand-alone offer without a plan for bundling or up-selling, there was no offsetting increase in units per customer and nothing to offset the negative mix. Customer count variance was the only potential offset and was the only unknown in the analysis.(How badly would the customer count have declined if the promotion had not been executed?)
The Varice Tree showed how the business had to depend on the promotion to bring in substantial traffic because it did not manage the risk of mix erosion. When the flow of customer traffic didn’t materialize, performance eroded. By thinking about the impact of decisions from the perspective of The Variance Tree, the business can articulate and quantify the risks it is taking.
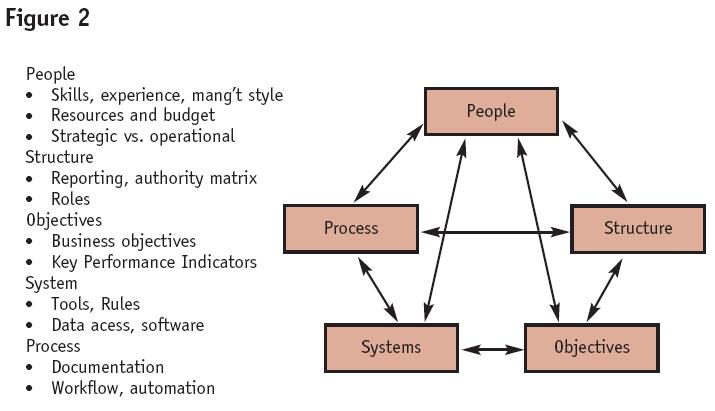
Planning for successful implementation
As with any change to the business metrics, developing a change management strategy is critical to a successful implementation. Using a framework like the one shown in Figure 2 helps teams think through the organizational changes required.
If customer counts have fallen in particular regions, yet the rest of the Tree seems to be in line with overall results, perhaps a competitor has made a move in that region.
We have found that prototyping the tool using spreadsheets is a way to use real data as you build support for developing a more robust tool that integrates into existing review processes and performance objectives. It has also been effective for breaking accountability for performance into its composite parts. Using the retail gasoline example, it is wise to make marketing, rather than sales,accountable for the mix of premium gasoline grades. Similarly, the regional manager has little influence on whether outlets are opened or closed in their area; that is the responsibility of business development.
As you build support for a Variance Tree initiative, remember that designing the tree is an exercise that is unique to your business and critical to the ultimate success of your initiative. Price, volume and mix are the starting point, but an understanding of the business is necessary to develop the next tier. We have found that experienced sales and marketing managers are a good source of input. This is where their gut instincts can be put to good use. They are usually thankful to see metrics that help them sharpen their focus on the business.
A continuous cycle of improvementand journey to pricing excellence
The Variance Tree is a step in the path to bring greater certainty to pricing decisions. Ultimately, by having a forecast of the volume impact under different pricing assumptions, you can forecast the profit impact. Adding the long-term impact on customer loyalty gives you a complete model. There are several steps along the way to that goal. Because The Variance Tree is built up from item level transactional data,the variances can be broken into their composite parts. You can split the mix branch into key items to see what mix trade-offs customers have made, and how these have affected the business. If results have been negative or unexpected, you can take action to remedy the situation. If customer counts have fallen in particular regions, yet the rest of the Tree seems to be in line with overall results, perhaps a competitor has made a move in that region. If there are price changes in that region that are out of sync with the rest of the business, perhaps that regional manager has been too aggressive in taking price increases. Once the problem (or a success) has been properly diagnosed, developing the solution becomes significantly easier – a problem well-defined is half solved. Senior managers will naturally start addressing the accountability issues that this tool will uncover. They will also begin to rely on it to help them make future pricing decisions.
Determining price elasticity is difficult because not all volume changes are due to changes in price.
The Holy Grail on this journey is to develop an understanding of price elasticity. Price elasticity is defined as the percentage change in volume in response to a per cent change in price. Determining price elasticity is difficult because not all volume changes are due to changes in price. However, with the data in The Variance Tree, you can begin to tabulate the history of price and volume changes. If you supplement this analysis with won/lost performance analysis, chronology of external events(e.g. promotions) or pricing research, it will sharpen the picture. And once you understand elasticity you can build a forecast of volume and margin as a function of price. This is the point where you have moved the business from managing on gut feel with mental models to controlling the price/volume trade-off with an objective model built on solid analytical principles.
Written by: Jim Saunders