Cost pressures and an increasingly competitive market have resulted in severe price increases across the restaurant industry. Research by the National Restaurant Association has found that menu prices on average have increased 4.7% percent last year, and quick service has increased by 6.7% – which was the highest increase U.S. consumers experienced in over a decade. The impact to promotion sales has been significant as well, as restaurants continue the risky practice of running promotions in an attempt to woo back customers.
Are promotions really risky business? Discounts, coupons and other types of promotions have played a historically crucial role in the restaurant industry; a well-executed promotion can lift volume, revenue, margins, and guest count while an ill-conceived or poorly executed promotion can have a dramatically negative impact in these same areas, resulting in lost revenue, decreased traffic and diminished margins.
In today’s competitive environment, restaurant chains just can’t afford to take risks with their promotions. That’s why Pricing Solutions has developed an in-house modeling tool for the restaurant industry that uses advanced analytics to accurately determine the effectiveness of promotions. Designed to improve restaurant profit margins, this tool provides several sets of pre-optimized pricing recommendations based on our proprietary predictive algorithms. The key is that the Pricing Solutions model is fully customizable based on your data and goals.
The results are extremely effective when analyzing promotions and also enable you to experiment with your own scenarios to test the expected impact of your promotion immediately. With predictive functionality, restaurants can now see what would have happened without the promotion. These insights allow Pricing Solutions to see the true lift generated by the promotion in terms of volume, revenue, margin, and guest count.
Measure Your Lift
It is very important for restaurants to understand the impact that their promotions have on sales, revenue, margins, guest count, and traffic. Historically this information has been difficult to uncover, but now with our expertise restaurants can:
- Estimate the revenue, margin, traffic impact of running a promotion
- Compare the effectiveness of several promotions (especially ones that are run concurrently) to uncover the one that is driving the most (or least) revenue
- Determine the effect of a promotion on the volume of promoted items as well as all other items (substitutes and complements)
- Predict the revenue impact of a promotion and compare it with the cost of running it to understand the true impact before they run the promotion.
Companies can also use the insights gained from our analysis to make informed decisions about the ideal timing and length of the promotion, which menu items to promote and at what price, and ultimately whether a promotion should be repeated.
Here’s how it works.
Example One: An Effective Promotion – Burger & Soft Drink Promotion
Our client is a large US restaurant chain with approximately 600 locations across the United States. Historically, the chain has run multiple promotions, often concurrently. The timing of these promotions has made it difficult to determine not only how much revenue and traffic the promotions generate, but also which promotions generate revenue.
This graph tracks revenue from burger and soft drink sales over time.
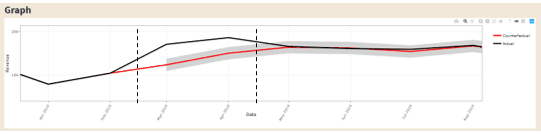
Dashed lines – indicate the start and end of the promotional period
Black curve – indicates actual revenue
Red curve – indicates what would have happened without the promotion
The graph above clearly tracks the results of the promotion, showing a lift in revenue during the promotional period and no revenue dip after the promotion. This is an ideal situation for the restaurant, and as such the chain knows that the promotion is effective in boosting revenue. But will the boost in revenue have a significant impact on the sale of other menu items?
This graph tracks revenue from burger and soft drink sales over time.
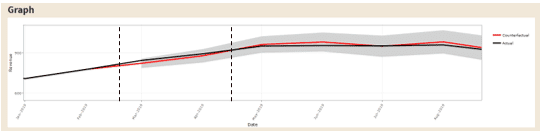
Dashed lines – indicate the start and end of the promotional period
Black curve – indicates actual revenue
Red curve – indicates what would have happened without the promotion
Our modeling tool revealed that the promotion was not only effective, but it also had minimal impact on other categories while driving sales and increased revenue. This data further cements the chain’s understanding that this promotion was effective and is worth repeating.
Example Two: An Ineffective Promotion
It’s equally as important for restaurants to identify promotions that are not working as intended. That was the case with our client who ran the following energy drink promotion:
This graph shows the revenue for an energy drink (Brand A) over time.
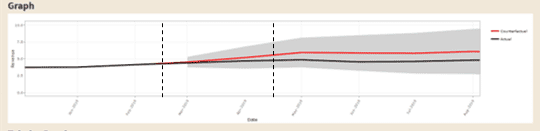
Dashed lines – indicate the start and end of the promotional period
Black curve – indicates actual revenue
Red curve – indicates what would have happened without the promotion
As you can see, the actual revenue dropped during the promotional period. The reason for this drop is that another energy drink promotion on a competing brand (Brand B) ran concurrently. A classic example of Cannibalization and Breakeven Analysis, Brand B’s promotion ended up monopolizing the total volume for this product and the client ultimately sold less of Brand A at a lower price. This data revealed a clear takeaway – ensure these promotions run at different times.
A Better Way
Optimization used to be a “nice to have”, or even a key differentiator, but today it’s become standard across the restaurant industry, and those not using value-based optimization techniques to plan and execute promotions are falling behind. We would love to discuss how you can effectively use promotions to improve your margins and profitability, drive your guest count and build on your continued success. Reach out to us to learn more about the impact of promotion sales in your restaurant.


